Master Stock Screeners: How to Use Them Like a Professional Analyst
Introduction: Navigating the Ocean of the Stock Market
Every single day, thousands of stocks trade across major global exchanges like the NYSE and NASDAQ. For an individual investor, sifting through this massive ocean of data manually is nearly impossible. If you tried to analyze every single company’s balance sheet, income statement, price-to-earnings ratio, and chart patterns one by one, opportunities would pass you by before you even scratched the surface.
This is where stock screeners transform your approach from guesswork to precision engineering.
Just as a professional financial strategist uses advanced systems to maximize tax efficiency and structure portfolios (a core philosophy we champion here at CleverCoins), savvy investors use stock screeners to cut through the financial noise. A stock screener acts as your personal digital filter, narrowing down thousands of publicly traded companies to a handful of high-potential candidates that match your exact financial goals, risk appetite, and trading style.
In this comprehensive, exhaustive guide, we will break down what stock screeners are, how they work under the hood, key metrics you must track, and a step-by-step blueprint on how to build customized filters that unearth market-beating investments.
Chapter 1: What Exactly is a Stock Screener?
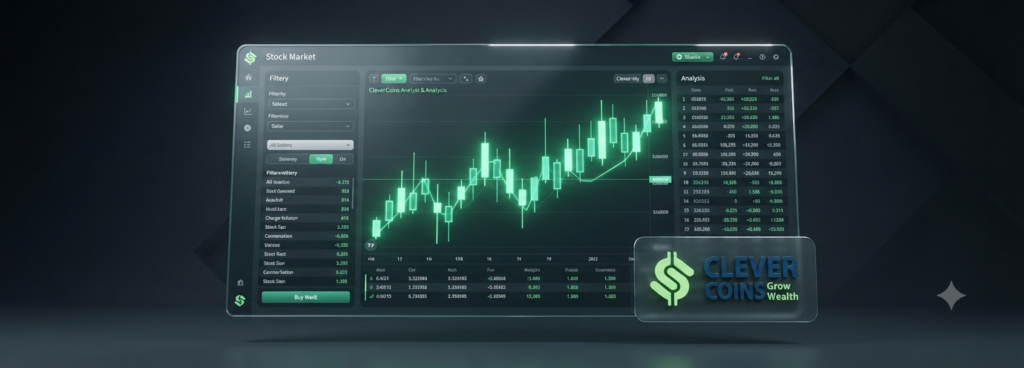
At its core, a stock screener is a software tool or web application that allows investors to filter stocks based on specific financial, fundamental, and technical criteria.
Think of it like shopping on an e-commerce website for a laptop. If you want a laptop with at least 16GB of RAM, an SSD hard drive, and a budget under $1,000, you don’t scroll through every computer available. You plug those parameters into filters, and the site instantly displays the exact models matching your needs.
Stock screeners do the exact same thing for the stock market. Instead of hardware specifications, you feed the database criteria such as:
- Market Capitalization (Micro-cap, Small-cap, Mid-cap, Large-cap)
- Valuation Multiples (P/E ratio, P/B ratio, EV/EBITDA)
- Profitability Metrics (Return on Equity, Profit Margins)
- Technical Indicators (Moving averages, Relative Strength Index)
By applying these constraints, a universe of 8,000+ global stocks can be whittled down to a curated watchlist of 10 or 15 companies in mere seconds.
Chapter 2: Why Every Investor Needs a Stock Screener
Before diving into how to use a screener, it helps to understand why relying on stock tips, social media hype, or random browsing is a recipe for underperformance. Integrating a stock screener into your routine offers several distinct advantages:
- Saving Time and Energy: Time is your most valuable asset. Screeners automate hours of tedious data collection.
- Removing Emotional Bias: Markets are driven by fear and greed. Screeners operate purely on cold, hard data, keeping your biases at bay.
- Discovering Hidden Gems: Most retail investors only look at mega-cap stocks like Apple, Microsoft, or Tesla. Screeners allow you to uncover under-the-radar small-cap stocks with massive growth trajectories.
- Enforcing Discipline: A screener forces you to define your strategy before buying anything. If a stock doesn’t pass your preset rules, you don’t buy it—end of story.
Chapter 3: Anatomy of Stock Screener Metrics
To use a screener effectively, you must understand the language it speaks. Metrics are generally categorized into three distinct buckets: Fundamental Metrics, Financial Health Metrics, and Technical Indicators.
1. Fundamental & Valuation Metrics
Valuation tells you whether a stock is cheap or expensive relative to its earnings or assets.
- Price-to-Earnings (P/E Ratio): Compares a company’s share price to its per-share earnings. A lower P/E can mean a stock is undervalued, though it can also indicate a struggling business.
- Price-to-Earnings Growth (PEG Ratio): Takes the P/E ratio and factors in expected earnings growth. A PEG ratio under 1.0 is often viewed as a sign of an undervalued growth stock.
- Price-to-Book (P/B Ratio): Compares a firm’s market capitalization to its book value (net assets). Useful for valuing capital-intensive industries like banking and manufacturing.
2. Profitability & Efficiency Metrics
These indicators show how well a company generates profit from its operations.
- Return on Equity (ROE): Measures how efficiently management uses shareholders’ equity to generate profit. Look for consistent ROE above 15%.
- Profit Margins (Operating and Net): High margins indicate pricing power and operational efficiency.
- Free Cash Flow (FCF): Cash is king. A company might show high net income on paper, but if it isn’t generating actual cash, it faces vulnerability.
3. Technical Indicators
For active traders, technical metrics measure price momentum and trends.
- Relative Strength Index (RSI): A momentum oscillator measuring speed and change of price movements on a scale of 0 to 100. Below 30 often signals oversold; above 70 signals overbought.
- Moving Averages (50-day and 200-day SMA): Used to identify overall market trends. Stocks trading consistently above their 200-day moving average are typically in long-term bull trends.
- Volume: High relative volume indicates heavy institutional interest in a stock breakout or breakdown.
Chapter 4: Step-by-Step Guide to Using a Stock Screener
Let’s walk through a practical, real-world execution of setting up a stock screen. While various platforms exist (such as TradingView, Finviz, or Yahoo Finance), the core workflow remains identical.
Step 1: Define Your Investment Strategy
Never open a screener blindly. Ask yourself: Am I looking for safe dividend-paying blue chips, hyper-growth tech stocks, or deeply undervalued turnaround plays? Your strategy dictates your filters.
Step 2: Set Market Capitalization Parameters
Decide what size of company you want to target.
- Large-cap ($10B+): Stable, often pay dividends, lower volatility.
- Small/Mid-cap ($300M – $10B): Higher growth potential, higher volatility.
Step 3: Filter for Financial Strength (The Safety Net)
Protect your capital by weeding out financially unstable companies.
- Set Debt-to-Equity < 1.0 (to ensure the company isn’t over-leveraged).
- Set Current Ratio > 1.5 (ensuring short-term assets cover short-term liabilities).
Step 4: Add Profitability Filters
Ensure the business model actually works.
- Set ROE > 10% or 15%.
- Set Positive Net Income over the last 3 to 5 fiscal years.
Step 5: Evaluate Valuation and Fine-Tune
Depending on whether you are a value or growth investor, filter your P/E ratio or PEG ratio. Sort the final output by volume or percentage change to see which filtered stocks are currently capturing market attention.
Chapter 5: Advanced Screening Strategies Used by Professionals
Once you master basic screening, you can implement multi-layered screening models inspired by legendary investors.
The Value Playbook (Benjamin Graham Style)
- P/E Ratio: Less than 15
- P/B Ratio: Less than 1.5
- Current Ratio: Greater than 2.0
- Long-Term Debt-to-Equity: Less than 0.5
The Growth Playbook (William O’Neil / CAN SLIM Style)
- Quarterly Earnings Growth (YoY): Greater than 25%
- Annual Earnings Growth (Past 3 Years): Greater than 20%
- Return on Equity (ROE): Greater than 17%
- Relative Price Strength: Greater than 80 (meaning it outperforms 80% of the market)
Chapter 6: Common Pitfalls to Avoid When Using Screeners
Even the best tool can lead you astray if misused. Keep these guardrails in mind:
- Falling into the “Value Trap”: A stock with an ultra-low P/E ratio isn’t always a bargain; sometimes the business model is dying. Always cross-examine fundamentals.
- Over-filtering: If you apply 30 strict parameters at once, you might end up with zero results. Start broad and narrow down progressively.
- Ignoring Macroeconomic Conditions: A screener looks at static snapshots in time. Always factor in interest rates, inflation, and sector tailwinds before hitting the buy button.
Conclusion: Build Your Financial Future with Precision
Stock screeners remove the emotional clutter from investing, allowing you to filter out the noise and focus exclusively on companies that meet your strict financial criteria. Just as professional planning secures your wealth and optimizes your long-term position, mastering stock screeners empowers you to take control of your financial destiny.
Start small, test different parameters, build your custom watchlists, and always remember that a disciplined process beats emotional speculation every single time.
- Website: org
- Email: client@clevercoins.org
- Phone: +91 77389 59862
- Address: Ideal Market, Mumbra, Thane-400612