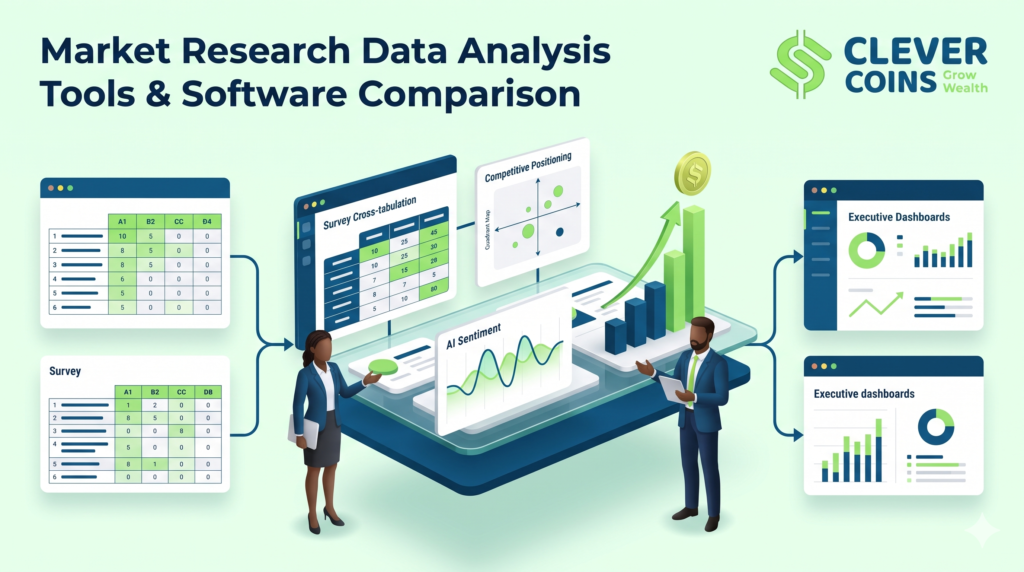
Market Research Data Analysis Tools & Software Comparison: The Complete 2026 Buyer’s Guide
Collecting market data is no longer the bottleneck for modern businesses. Between automated web surveys, CRM exports, search intelligence crawlers, social listening feeds, and point-of-sale logs, organizations sit on mountains of raw information. The real competitive advantage lies in what happens after collection: cleaning messy datasets, running valid statistical tests, spotting genuine consumer shifts, and translating numbers into decisions that protect margins and fuel growth.
Choosing the wrong software creates immediate friction. Buy an enterprise statistical package when your team just needs visual dashboards, and licenses sit unused while analysts wrestle with syntax. Rely solely on basic spreadsheets for multi-wave consumer tracking, and manual cross-tabulations eat weeks of billable hours while introducing silent formula errors.
This comprehensive guide evaluates the leading market research data analysis tools available today across every functional category—from purpose-built survey analysis platforms and classical statistical engines to business intelligence (BI) suites, competitive intelligence aggregators, qualitative coding platforms, and AI-native data assistants.
Why Market Research Data Analysis Requires Purpose-Built Software
General-purpose spreadsheets remain the starting point for almost every analyst, yet market research data behaves differently from standard accounting ledgers or operational logs. Understanding those structural differences explains why specialized software exists:
Multi-Response and Nested Variables: A single survey question such as “Which of these five brands have you purchased in the last 90 days?” generates five binary columns that must be analyzed as a single unified variable set rather than isolated fields.
Respondent Weighting and Rim Weighting: Real-world samples rarely match target population demographics perfectly. Market research tools apply mathematical weights to individual respondents so subgroup totals remain accurate without distorting sample sizes during significance testing.
Automated Statistical Significance Testing: Comparing customer satisfaction across four regions or three age brackets requires instant t-tests, z-tests, and chi-square checks—often with column-letter indicators showing whether a 4% lift is genuine signal or random sampling noise.
Unstructured Open-Ended Text: Modern studies mix closed numerical ratings with thousands of open-ended verbatim comments, requiring natural language processing (NLP), sentiment scoring, and thematic coding alongside quantitative cross-tabs.
When you match your software stack to these specific analytical demands, turnaround time drops from weeks to hours and executive confidence rises dramatically.
The 6 Core Categories of Market Research Data Analysis Tools
Rather than treating every platform as a direct rival, smart research buyers evaluate software within six distinct functional categories. Most mature insights teams combine two or three complementary tools.
| Category | Primary Job to Be Done | Typical Data Inputs | Representative Tools |
| 1. Purpose-Built Survey & Research Platforms | Cross-tabs, weighting, driver analysis, automated reporting | SPSS .sav, Qualtrics, Decipher, CSV, SQL | Displayr, Q Research Software, Infotools Harmoni, QuestionPro |
| 2. Classical Statistical & Programming Engines | Advanced modeling, regressions, custom machine learning | Structured tables, databases, experimental datasets | IBM SPSS Statistics, R, Python, SAS, Minitab |
| 3. Business Intelligence (BI) & Visualization | Executive dashboards, KPI monitoring, multi-source blending | Data warehouses, SQL, Excel, cloud apps | Microsoft Power BI, Tableau, Looker Studio, Zoho Analytics |
| 4. Market, Web & Competitive Intelligence | Traffic estimation, share of voice, TAM/SAM sizing, SEO gaps | Web crawls, search engines, firmographics, filings | Similarweb, Semrush, Ahrefs, Contify, AlphaSense |
| 5. Qualitative & Mixed-Methods Analysis | Thematic coding of interviews, focus groups, media transcripts | Audio/video, PDFs, interview notes, open-ended text | MAXQDA, Dedoose, NVivo |
| 6. AI-Native Spreadsheets & Synthesizers | Natural-language querying, rapid desk research, automated charts | Ad-hoc CSVs, live web search, connected databases | Sourcetable, Julius AI, IdeaProof, Perplexity |
Deep-Dive Comparison: Top Market Research Data Analysis Software
1. Purpose-Built Survey & Market Research Analysis Platforms
These platforms are engineered specifically around respondent-level data, questionnaire logic, and researcher workflows.
Displayr
Displayr is a cloud-based market research analysis and reporting platform designed to handle everything after survey data collection. It bridges the gap between heavy statistical engines and executive storytelling by combining automated data cleaning, R-backed advanced modeling (such as MaxDiff, conjoint analysis, and driver analysis), and live interactive dashboards.
Strengths: Eliminates manual syntax writing while preserving full statistical rigor; natively imports SPSS
.savfiles, Qualtrics, SQL, and Excel without stripping metadata labels; updates charts and PowerPoint exports automatically when new waves of tracker data arrive.Limitations: Higher per-creator seat cost (starting around $283–$354/user/month billed annually) makes it an investment geared toward dedicated research teams rather than casual occasional users.
Best For: Market research agencies, insights teams, and brand managers running recurring tracking studies, segmentation, or concept testing.
Q Research Software
Built by the same engineering team behind Displayr, Q is a Windows desktop application tailored for quantitative market researchers who want maximum speed in cross-tabulation and statistical testing.
Strengths: Automates tedious data preparation, variable recoding, and significance testing; includes built-in R integration for custom statistical routines; exports directly to Microsoft Office.
Limitations: Desktop-bound architecture lacks the browser-based collaborative dashboarding and stakeholder sharing that Displayr provides.
Best For: Quantitative research consultants and analysts who live in cross-tabs and PowerPoint decks all day.
Infotools Harmoni
Backed by Ipsos, Infotools Harmoni is an enterprise market research platform built to harmonize multi-supplier, multi-country, and multi-wave brand tracking data in a single environment.
Strengths: Preserves complex weighting schemes across disparate file formats (SPSS, Dimensions, Decipher, Qualtrics); features AI-guided exploration via ChatHarmoni to surface statistically meaningful shifts automatically; supports strict enterprise governance for global brand trackers.
Limitations: Requires structured onboarding and dataset architecture setup upfront; not designed to replace general financial BI tools.
Best For: Enterprise consumer brands (FMCG, telecom, electronics) managing continuous global brand health and usage-and-attitude (U&A) studies.
QuestionPro (Research Suite)
QuestionPro combines enterprise survey creation, panel distribution, and built-in analytical modules—including conjoint, MaxDiff, Turf analysis, and text sentiment—under one roof.
Strengths: Seamless end-to-end workflow from questionnaire programming to cross-tabulation and dashboard sharing without exporting files between vendors.
Limitations: While broad, specialized statistical customization is less flexible than dedicated standalone analysis environments.
Best For: Mid-market organizations and corporate insights teams wanting an all-in-one collection-plus-analysis platform.
2. Classical Statistical & Data Science Engines
When research demands custom econometric modeling, bespoke machine learning, or academic-grade validation, general statistical packages remain the gold standard.
IBM SPSS Statistics
For decades, SPSS has been the foundational desktop statistical package in academia and traditional market research. Its menu-driven interface lets researchers execute t-tests, ANOVA, factor analysis, cluster segmentation, and logistic regressions without writing code.
Strengths: Universally recognized
.savfile standard that preserves variable and value labels; thoroughly validated statistical algorithms; massive global talent pool familiar with the interface.Limitations: Expensive licensing (starting around $105–$127/month per user before add-on modules); slow for creating publication-ready client dashboards or automating recurring tracker updates without custom syntax scripts.
Best For: Academic researchers, government agencies, and traditional research firms needing validated menu-driven statistical tests.
R & Python (Open-Source Ecosystem)
R (with packages like survey, tidyverse, and lavaan) and Python (with pandas, statsmodels, scikit-learn, and NLP libraries) offer limitless analytical power at zero software license cost.
Strengths: Completely free and open-source; capable of custom Bayesian hierarchical modeling, structural equation modeling, large-scale text embeddings, and automated data pipelines; reproducible via code scripts.
Limitations: Steep learning curve; poor native speed for exploratory cross-tabulation formatting compared to specialized research tools; requires engineering discipline to maintain.
Best For: Data science teams, quantitative methodologists, and organizations analyzing massive behavioral or unstructured datasets.
Minitab
Originally built for Six Sigma and quality engineering, Minitab excels at statistical process control, design of experiments (DOE), and reliability analysis.
Strengths: Guided assistant walks non-statisticians through choosing the right hypothesis test; strong visual diagnostic plots.
Limitations: High base cost (around $200/month) plus extra fees for specialty modules; lacks survey-specific features like multiple-response banners or rim weighting.
Best For: Product engineering, manufacturing, and operational research teams testing physical product performance.
3. Business Intelligence (BI) & Visual Analytics Platforms
BI platforms excel at uniting operational, financial, and behavioral metrics into interactive executive dashboards—though they require careful configuration when handling survey data.
Microsoft Power BI
Power BI dominates corporate analytics due to its tight integration with Excel, Azure, and Microsoft 365, paired with aggressive entry pricing.
Strengths: Low entry cost ($14/user/month for Pro, plus a free desktop tier); powerful DAX modeling engine; effortless sharing across enterprise organizations already on Microsoft 365.
Limitations: Not natively built for survey structures—calculating statistical significance between banner columns or handling multi-punch variables requires complex custom DAX workarounds.
Best For: Internal corporate teams blending customer satisfaction KPIs with sales, CRM, and financial telemetry.
Tableau
Tableau remains a benchmark for visual data exploration, allowing analysts to drag and drop dimensions to uncover patterns rapidly.
Strengths: Best-in-class visual flexibility and interactive storytelling; handles large datasets smoothly; strong community ecosystem.
Limitations: Creator licenses scale higher ($15/user/month for Viewer up to $75/user/month for full Creator tiers); like Power BI, lacks built-in survey weighting and automated significance testing.
Best For: Data visualization specialists and executive teams building exploratory visual portals across diverse business metrics.
Zoho Analytics & Looker Studio
For startups and lean teams, Zoho Analytics (starting around $30/month flat rate with a free tier) and Google Looker Studio (free core product) deliver fast, accessible dashboarding without heavy enterprise contracts. Looker Studio connects seamlessly to Google Analytics 4, BigQuery, and Google Sheets, making it ideal for digital marketing attribution and web behavior reporting.
4. Market, Web & Competitive Intelligence Platforms
Primary surveys tell you why consumers behave a certain way; competitive and market intelligence tools reveal what is happening across the broader digital and financial landscape.
Similarweb
Similarweb aggregates massive panels of digital clickstream and web signals to estimate competitor website traffic, channel mix, audience demographics, and AI search visibility.
Strengths: Unmatched visibility into competitor acquisition channels, referral traffic, and category demand trends; includes AI Search Intelligence for tracking brand presence in generative answers.
Limitations: Full platform plans start around $199–$999/month; traffic estimates lose precision on niche or low-traffic websites.
Best For: Digital strategists, e-commerce leaders, and growth teams benchmarking digital market share.
Semrush & Ahrefs
Originally SEO platforms, both Semrush (starting around $139/month) and Ahrefs (starting around $29–$129/month) have evolved into indispensable market demand engines. Search volume, keyword intent, and AI citation tracking act as real-time, unfiltered behavioral focus groups showing exactly what buyers are searching for.
Strengths: Semrush’s Market Explorer maps competitor audience overlap and growth quadrants, while Ahrefs excels at content gap discovery and backlink/citation intelligence.
Best For: Content strategists, product marketers, and founders validating organic demand and competitive positioning.
Contify & AlphaSense
For B2B and enterprise strategy teams, Contify uses AI to monitor thousands of news, regulatory, and competitor sources into curated intelligence feeds, while AlphaSense provides deep AI search across earnings call transcripts, SEC filings, broker research, and expert interviews.
5. Qualitative & Mixed-Methods Analysis Software
Quantitative numbers reveal how many customers churned; qualitative analysis uncovers the emotional and practical reasons why.
MAXQDA & NVivo: Desktop and cloud suites designed for structured coding of interview transcripts, focus group videos, PDFs, and open-ended survey responses. Researchers tag themes, measure code co-occurrence, and link qualitative quotes directly to demographic segments. MAXQDA starts around $49/month.
Dedoose: A lightweight, browser-based mixed-methods platform (starting around $13–$18/month) ideal for distributed research teams collaborating on qualitative coding alongside quantitative descriptors.
6. AI-Native Spreadsheets & Research Synthesizers
A newer wave of AI-first tools accelerates exploratory analysis for founders, consultants, and non-technical operators:
Sourcetable & Julius AI: AI-connected spreadsheets and file analysts (around $20–$39/month) that let users upload raw CSV/Excel survey exports and ask natural-language questions to clean columns, run Python-backed regressions, and generate publication-ready charts automatically.
IdeaProof & Perplexity: Real-time AI research synthesizers that cross-reference web data to generate rapid Total Addressable Market (TAM/SAM/SOM) sizing, competitor matrices, and early-stage demand validation in minutes rather than weeks.
Side-by-Side Comparison Matrix: Pricing, Learning Curve & Best Fit
| Software Tool | Primary Category | Verified Starting Price (2026) | Free Tier / Trial | Learning Curve | Ideal User Profile |
| Displayr | Survey Analysis & Reporting | ~$283–$354/user/mo (annual) | Free version & trial | Low–Moderate | Market research teams & agencies |
| Q Research Software | Quantitative Survey Analysis | ~$272/mo | Free trial | Low–Moderate | Quant researchers & consultants |
| Infotools Harmoni | Enterprise Brand Tracking | Custom enterprise quote | Demo available | Moderate | Global consumer & FMCG brands |
| IBM SPSS Statistics | Classical Statistical Engine | ~$105–$127/user/mo | Free trial | High | Academics & traditional statisticians |
| R / Python | Open-Source Data Science | Free ($0) | Open-source | Very High | Data scientists & ML engineers |
| Microsoft Power BI | Corporate BI & Dashboards | $14/user/mo (Pro) | Free desktop tier | Moderate | Microsoft-centric business analysts |
| Tableau | Visual Analytics & BI | $15–$75/user/mo | Free trial / Public | Moderate | Visual BI specialists & enterprises |
| Zoho Analytics | SMB & Mid-Market BI | $30/mo flat rate | Free tier & trial | Low–Moderate | Startups & growing SMBs |
| Similarweb | Digital Market Intelligence | $199–$999/mo | Free Chrome extension | Low | Digital growth & e-commerce teams |
| Semrush | Search & Market Intelligence | $139/mo | Limited free tier | Low–Moderate | SEO, content & product marketers |
| MAXQDA | Qualitative & Mixed Methods | ~$49/mo | Free trial | Moderate | UX researchers & qualitative leads |
| Julius AI / Sourcetable | AI Data Analysis | $20–$39/mo | Free tier / trial | Very Low | Founders, operators & consultants |
Key Evaluation Criteria: How to Choose the Right Software Stack
Before signing an annual contract, evaluate every candidate tool against six practical operational criteria:
1. Native Data Structure Compatibility
Ask where your raw data originates. If you run surveys in Qualtrics, SurveyMonkey, or Decipher, check whether the analysis software imports .sav or API feeds with variable labels, multi-response sets, and missing-value definitions intact. Losing metadata during CSV exports forces analysts to spend hours manually relabeling columns.
2. Statistical Rigor vs. Speed-to-Insight
Consider who will actually operate the software. If your team consists of product managers and marketers rather than trained statisticians, a tool with built-in automated significance testing and plain-English safeguards (like Displayr or Q) prevents false conclusions far better than an unguided statistical console.
3. Automation of Recurring Waves
Ad-hoc one-off studies can survive manual chart formatting; quarterly brand trackers or monthly customer satisfaction (CSAT) waves cannot. Verify whether uploading a new month’s data file automatically refreshes every cross-tab, significance test, and executive slide without rebuilding layouts from scratch.
4. Qualitative + Quantitative Integration
Modern market research rarely separates numbers from narrative. Prioritize platforms that let you cross-tabulate AI-coded open-ended themes (for example, “Pricing Complaint” or “Onboarding Friction”) directly against quantitative NPS scores, customer tenure, or spend tiers.
5. Total Cost of Ownership (Creator vs. Viewer Seats)
Look closely at licensing tiers. Many platforms advertise low entry prices that balloon once you add creator seats, advanced statistical add-on modules (which can add $500+/year per module), API connectors, or larger row limits. Map out how many analysts need full build permissions versus how many stakeholders only need read-only dashboard links.
6. Data Privacy, Security & Compliance
Market research datasets frequently contain Personally Identifiable Information (PII), customer emails, or proprietary financial metrics. Confirm SOC 2 Type II compliance, role-based access controls, regional data residency options, and clear policies ensuring your proprietary survey data is never used to train public third-party AI models.
Recommended Tool Stacks by Business Stage & Team Size
Early-Stage Startups & Bootstrapped Founders: Pair Google Looker Studio (free) + Google Trends (free) + Julius AI or Sourcetable ($20–$39/mo). You get rapid market validation, automated spreadsheet cleaning, and clean investor-ready charts for under $50/month.
Growing D2C & Mid-Market Brands: Combine Zoho Analytics ($30/mo) or Power BI ($14/user/mo) for internal sales/cohort dashboards with Semrush ($139/mo) for search demand intelligence and QuestionPro for structured customer surveys.
Dedicated Insights Teams & Research Agencies: Standardize on Displayr or Q Research Software as your core analytical engine, supplemented by MAXQDA for qualitative interviews and Python/R for bespoke predictive modeling.
Enterprise Consumer & Global Brands: Deploy Infotools Harmoni for multi-market brand tracking alongside Tableau for executive operational BI and Similarweb / AlphaSense for macro competitive intelligence.