
Understanding Marketing Attribution Models: Expert Tips to Master ROI in 2026
Modern buyers rarely see a single advertisement, click it immediately, and pull out their credit cards. Instead, the average consumer or B2B decision-maker weaves through an intricate web of touchpoints—discovering a brand on LinkedIn, reading an organic blog post, watching a YouTube breakdown, clicking a retargeting ad, subscribing to an email newsletter, and finally converting through a branded Google search.
When that final conversion happens, a critical question determines the future profitability of your entire marketing budget: Which channel actually deserves the credit?
Assigning 100% of the credit to the final branded search click convinces executives that paid search is a miracle worker while content marketing and social media are money pits. Cutting those top-of-funnel budgets then starves the pipeline, causing overall revenue to collapse months later. Conversely, relying on inflated, self-reported conversions from individual ad platforms leads to double- and triple-counting the exact same sale.
Understanding marketing attribution models solves this fundamental measurement dilemma. By establishing clear, mathematical rules—or machine-learning algorithms—to distribute conversion credit across the customer journey, businesses gain the visibility required to allocate capital with precision, lower customer acquisition costs (CAC), and scale revenue predictably.
What Is Marketing Attribution and Why Does It Matter?
Marketing attribution is the analytical framework used to identify, measure, and assign credit to the specific marketing touchpoints, channels, campaigns, and assets that influence a customer to take a desired action—such as making a purchase, booking a demo, or submitting a qualified lead.
An attribution model is the specific rulebook or statistical methodology that determines how that credit is divided among the interactions along the buyer’s path.
The High Cost of Getting Attribution Wrong
Industry benchmarks highlight a massive disconnect between perceived measurement confidence and actual execution. While over 85% of marketers report feeling confident in their ability to measure holistic ROI, fewer than one-third actually implement unified, multi-touch measurement. Meanwhile, platforms like Google Ads, Meta, and LinkedIn operate inside walled gardens with conflicting lookback windows and self-serving attribution logic. If you simply add up the conversions reported inside each ad manager, the total frequently exceeds actual bank-account revenue by 200% to 300%.
When your attribution model is flawed, three costly business failures occur:
Chronic Underinvestment in Demand Creation: Single-touch models blind you to the podcasts, organic articles, and upper-funnel video campaigns that introduced the customer to your brand in the first place.
Over-Subsidizing Branded Capture: Bottom-of-funnel channels (such as branded search or last-minute coupon affiliates) capture demand that other channels worked hard to create, hoarding budget increases they did not independently earn.
Misaligned Sales and Marketing Teams: Without shared visibility into how multi-touch journeys convert into closed-won revenue, marketing optimizes for cheap, low-intent leads while sales complains about pipeline quality.
The Evolution of Marketing Attribution in 2026
Marketing attribution has undergone a structural transformation driven by privacy regulations, browser architecture, and artificial intelligence:
The Post-Cookie Reality: With major browsers restricting third-party cookies and mobile operating systems enforcing strict tracking transparency, legacy pixel-based cross-site tracking no longer captures complete user journeys. First-party data collection, server-side tagging, and unified customer data warehouses have become mandatory foundations.
Longer, Non-Linear Buying Journeys: Modern B2B buying cycles now average over 270 days and involve 8 to 12 distinct touchpoints across multiple buying committee members. Even considered B2C purchases routinely span 5 to 8 interactions.
Black-Box AI Ad Campaigns: Automated campaign formats—such as Google’s Performance Max and Meta’s Advantage+—dynamically shift budget across search, display, video, and social placements. Marketers need independent attribution frameworks to verify whether these algorithms are generating genuinely new customers or merely retargeting existing warm audiences.
The Convergence of MTA, MMM, and Incrementality: Rather than relying on a single silver-bullet model, mature organizations in 2026 combine Multi-Touch Attribution (MTA) for tactical campaign optimization, Marketing Mix Modeling (MMM) for macro budget allocation, and Incrementality Testing to prove true causal lift.
Core Categories of Marketing Attribution Models
Marketing attribution models fall into three primary architectural tiers: Single-Touch Models, Rule-Based Multi-Touch Models, and Algorithmic / Data-Driven Models.
1. Single-Touch Attribution Models
Single-touch models assign 100% of the conversion credit to one isolated interaction in the customer journey, completely ignoring every other touchpoint.
Last-Touch (Last-Click) Attribution
How It Works: Gives 100% of the credit to the final touchpoint the customer interacted with immediately before converting.
Example: A buyer discovers your software via a LinkedIn article, downloads a whitepaper via email, and three weeks later types your brand name into Google and clicks a Paid Search ad to buy. Paid Search receives 100% of the credit; LinkedIn and Email receive 0%.
Pros: Extremely easy to implement, requires minimal data volume, and clearly identifies which channels close deals at the bottom of the funnel.
Cons: Severely undervalues upper- and mid-funnel marketing, encourages short-term thinking, and often rewards channels that merely harvest existing intent.
Best For: Businesses with ultra-short, impulse-driven sales cycles (under 24 hours) or companies with fewer than 100 monthly conversions that lack sufficient data for complex modeling.
Last Non-Direct Click Attribution
How It Works: Ignores “Direct” traffic (when a user types your URL directly into their browser or uses a bookmark) and assigns 100% of the credit to the last identifiable marketing channel before that direct session.
Pros: Prevents “Direct” traffic from masking the true marketing channel that drove the user to return and convert.
Cons: Still ignores all earlier discovery and nurturing touchpoints prior to the final non-direct interaction.
Best For: Quick directional sanity checks inside analytics platforms when comparing paid and organic closing efficiency.
First-Touch (First-Click) Attribution
How It Works: Gives 100% of the conversion credit to the very first touchpoint that introduced the prospect to your brand.
Pros: Highlights which awareness channels, top-of-funnel content, and outbound campaigns successfully generate net-new audience discovery.
Cons: Completely ignores the nurturing sequences, product demos, retargeting ads, and sales touchpoints required to turn raw awareness into revenue.
Best For: Early-stage startups aggressively focused on top-of-funnel market penetration and brand discovery where building initial awareness is the primary KPI.
2. Rule-Based Multi-Touch Attribution (MTA) Models
Multi-touch attribution models distribute credit across multiple interactions in the buyer’s path using predetermined mathematical weightings.
Linear Attribution
How It Works: Splits conversion credit equally across every recorded touchpoint in the customer journey. If a customer interacts with four touchpoints—Organic Social, Blog Post, Email Newsletter, and Paid Search—each channel receives exactly 25% credit.
Pros: Simple to explain to stakeholders, eliminates single-touch blind spots, and ensures every contributing channel receives recognition.
Cons: Treats a passive, two-second display ad view as equally influential as a 45-minute product webinar or a high-intent pricing page visit.
Best For: Organizations transitioning away from single-touch reporting that want an unbiased baseline view of cross-channel participation.
Time-Decay Attribution
How It Works: Assigns progressively greater credit to touchpoints that occur closer in time to the final conversion. Typically governed by a half-life formula (for example, a 7-day half-life means a touchpoint occurring 7 days before conversion receives half the credit of a touchpoint on the day of conversion).
Pros: Reflects the psychological reality that recent interactions often carry stronger immediate purchase momentum while still acknowledging earlier discovery touches.
Cons: Systematically discounts top-of-funnel awareness channels that initiated the journey weeks or months earlier.
Best For: Promotional retail campaigns, time-sensitive e-commerce offers, and businesses with short-to-medium consideration windows where bottom-of-funnel velocity matters most.
Position-Based (U-Shaped) Attribution
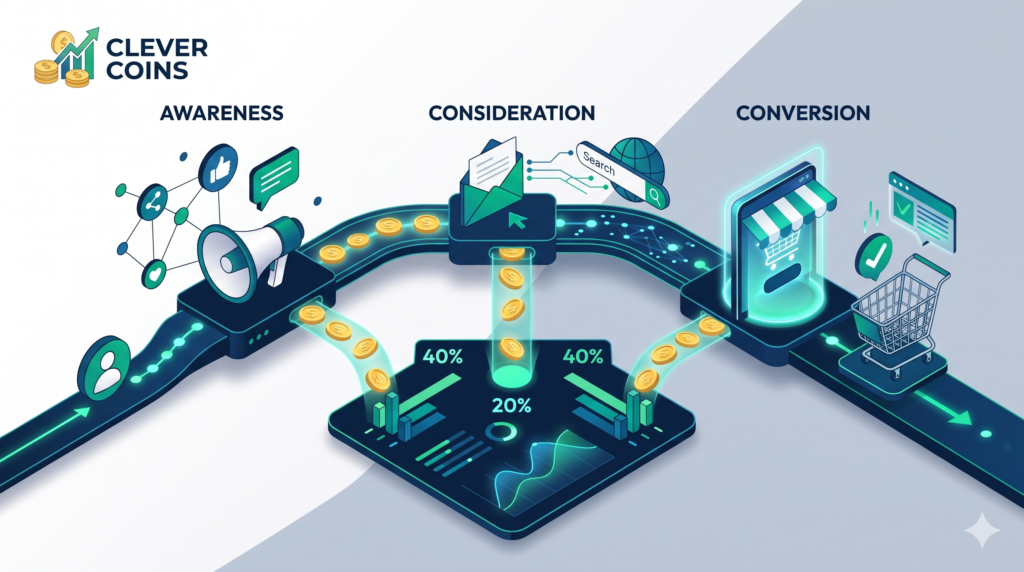
How It Works: Assigns 40% credit to the First Touch (lead creation/discovery) and 40% credit to the Last Touch (conversion), while distributing the remaining 20% equally across all intermediate nurturing touchpoints.
Pros: Balances the two most pivotal milestones in marketing—capturing initial attention and closing the conversion—without rendering mid-funnel nurturing invisible.
Cons: Assumes mid-funnel touchpoints are always less impactful than first and last touches, which may not hold true in consultative sales.
Best For: Lead-generation businesses, SaaS companies with self-serve trials, and balanced omnichannel marketers running both awareness and conversion campaigns.
W-Shaped Attribution
How It Works: Designed specifically for B2B funnels, this model assigns 30% credit to the First Touch (anonymous visitor discovery), 30% credit to the Lead Creation Touch (form fill/MQL), and 30% credit to the Opportunity Creation Touch (SQL/sales pipeline entry), distributing the remaining 10% across all other interactions.
Pros: Aligns marketing performance directly with CRM pipeline milestones and recognizes the critical handoff between marketing and sales.
Cons: Stops tracking credit allocation after opportunity creation, ignoring late-stage sales enablement content that helps close the deal.
Best For: B2B companies with structured lead-to-opportunity stages and dedicated sales development teams.
Full-Path (Z-Shaped) Attribution
How It Works: Extends the W-Shaped model across the entire revenue lifecycle by assigning 22.5% credit each to four major milestones: First Touch, Lead Creation, Opportunity Creation, and Closed-Won Deal, with the remaining 10% split across intermediate touches.
Pros: Provides complete end-to-end revenue accountability from first click to signed contract, capturing the impact of account-based marketing (ABM) and late-stage case studies.
Cons: Requires tight technical integration between marketing automation software, web analytics, and CRM deal stages.
Best For: Enterprise B2B organizations with long, multi-stakeholder sales cycles where marketing supports deals all the way to signature.
3. Algorithmic and Data-Driven Attribution (DDA) Models
Unlike static rule-based models that rely on human assumptions (e.g., guessing that first and last touches are worth 40% each), Data-Driven Attribution (DDA) uses machine learning and statistical game theory—most notably Shapley Value and Markov Chain modeling—to calculate each touchpoint’s true marginal contribution.
How Data-Driven Attribution Works
Path Comparison: The algorithm analyzes thousands of historical user journeys—comparing sequences that resulted in a conversion against nearly identical sequences that did not convert.
Counterfactual Probability: Using Shapley Value principles, the model calculates how much the probability of conversion increases when a specific touchpoint (e.g., a LinkedIn retargeting click) is added to a journey.
Dynamic Weighting: Rather than applying rigid percentages, credit is assigned dynamically based on actual empirical impact and continuously recalibrates as customer behavior shifts.
Custom Algorithmic Attribution
For high-volume enterprises, data science teams build bespoke attribution models in Python or R using Recurrent Neural Networks (RNNs) or causal inference frameworks. These custom models incorporate proprietary variables such as profit margins, customer lifetime value (LTV), product return rates, and offline sales interactions.
Comprehensive Comparison of Marketing Attribution Models
| Attribution Model | Credit Distribution Logic | Primary Advantage | Core Limitation | Ideal Use Case & Volume |
| Last-Touch | 100% to final interaction | Simple setup; highlights closing channels | Blind to awareness & nurturing; over-credits branded search | Impulse B2C; under 100 conversions/month |
| First-Touch | 100% to initial interaction | Measures top-of-funnel discovery power | Ignores conversion & nurturing mechanics | Brand awareness pushes; early-stage startups |
| Linear | Equal split across all touches | Easy to understand; values full participation | Over-credits low-impact touches (e.g., passive views) | Teams upgrading from single-touch; 100+ conversions |
| Time-Decay | Exponentially higher credit near conversion | Captures late-stage buying momentum | Undervalues early brand discovery | Short promo cycles; flash sales; 100+ conversions |
| Position-Based (U-Shaped) | 40% First / 20% Middle / 40% Last | Balances acquisition and conversion | Arbitrary fixed percentages | Lead gen & SaaS; 100–300 conversions/month |
| W-Shaped | 30% First / 30% Lead / 30% Opp / 10% Other | Aligns marketing with CRM pipeline stages | Stops at opportunity creation | B2B mid-market with sales handoffs |
| Full-Path (Z-Shaped) | 22.5% each to 4 key stages / 10% Other | End-to-end revenue visibility to Closed-Won | Requires strict CRM & UTM hygiene | Enterprise B2B; multi-month buying cycles |
| Data-Driven (DDA) | Machine learning / Shapley Value weights | Objective, empirical, continuously adapts | Requires high conversion volume (300–600+/mo) | Mature e-commerce & B2B with clean tracking |
Beyond Multi-Touch: The Unified Measurement Triad
Even the sharpest Multi-Touch Attribution model has blind spots. MTA relies on deterministic user-level tracking—meaning it cannot easily measure offline billboards, word-of-mouth referrals, podcast sponsorships, or view-through impressions inside privacy-restricted apps. To achieve total clarity, top-performing marketing teams pair MTA with two complementary methodologies:
1. Marketing Mix Modeling (MMM)
Marketing Mix Modeling is a top-down econometric technique that uses regression analysis on historical aggregate data (typically 2+ years of weekly or monthly spend, sales volume, seasonality, pricing changes, and macroeconomic factors) rather than individual user cookies.
Why It Matters: MMM captures offline channels (TV, radio, print, out-of-home), accounts for diminishing returns (saturation curves), and remains 100% immune to cookie deprecation or iOS privacy updates.
How to Use It: Use MMM for quarterly and annual strategic budget allocation across macro channels, while using MTA for weekly tactical campaign and creative optimization.
2. Incrementality Testing (Geo-Holdouts & Lift Studies)
Attribution models measure correlation—which channels were present when a customer converted. Incrementality testing measures causation—how many conversions would never have happened if you had turned that marketing channel off.
How It Works: Marketers divide comparable geographic regions into Test Markets (where ads run normally) and Control Markets (where ads are paused or held out). Comparing the revenue difference between the two groups reveals the true incremental lift of the campaign.
How to Choose the Right Attribution Model for Your Business
Selecting an attribution model should never be based on trends; it must match your monthly conversion volume, sales cycle length, and data infrastructure.
Step 1: Audit Your Monthly Conversion Volume
Machine learning models require statistical density to separate signal from noise.
Under 100 conversions/month: Stick to Last-Touch or Linear attribution. You do not have enough statistical volume for algorithmic models to learn reliably, and complex weighting will only create false precision.
100 to 300 conversions/month: Use Position-Based (U-Shaped) or W-Shaped attribution. Note that Google Analytics 4 (GA4) requires roughly 300 to 400 conversions per month to sustain Data-Driven Attribution; below that threshold, GA4 silently falls back to last-click logic.
300 to 600+ conversions/month: Activate Data-Driven Attribution (DDA) across GA4 and your ad platforms, supplemented by quarterly incrementality tests.
Step 2: Match Your Lookback Window to Your Sales Cycle
A lookback window defines how far back in time your attribution tool searches for touchpoints prior to a conversion. Applying a default 30-day window to a 180-day B2B sales cycle erases over 80% of the customer journey.
Fast-Moving E-Commerce (1–7 day cycle): Set a 7-day to 14-day lookback window using Data-Driven or Time-Decay modeling.
Considered B2C / SMB SaaS (14–45 day cycle): Set a 30-day to 60-day lookback window using Data-Driven or Position-Based modeling.
Enterprise B2B (90–270+ day cycle): Set a 90-day to 180-day lookback window (or unlimited CRM lifecycle tracking) using W-Shaped, Full-Path, or custom algorithmic models.
Step-by-Step Implementation Roadmap for Accurate Attribution
Phase 1: Establish Strict Tracking & UTM Governance
Garbage data produces confidently wrong financial decisions. Before activating any attribution model, enforce strict tracking discipline:
Standardize UTM Parameters: Mandate lowercase, standardized
utm_source,utm_medium,utm_campaign,utm_content, andutm_termtags across every paid ad, email link, social post, influencer bio, and QR code. A single typo (e.g.,LinkedInvs.linkedin) splits one channel into two fragmented data rows.Deploy Server-Side Tracking: Implement server-side Google Tag Manager (sGTM) and platform Conversion APIs (Meta CAPI, LinkedIn CAPI, Google Enhanced Conversions) to prevent browser ad-blockers from dropping conversion signals.
Configure Cross-Domain Tracking: Ensure user session IDs persist seamlessly as visitors move from your main marketing website (
yourdomain.com) to your application portal (app.yourdomain.com) or third-party checkout cart.
Phase 2: Integrate Web Analytics with CRM Revenue
Tracking form submissions or “Add to Cart” clicks is insufficient if half of those leads never pay.
Connect your website tracking directly to your CRM (HubSpot, Salesforce, Pipedrive) using hidden form fields that capture the visitor’s First-Touch UTM, Last-Touch UTM, and Google/Meta Click IDs (GCLID / FBCLID).
Pass offline conversion events (Qualified Lead, Opportunity Created, Closed-Won Deal Value) back to your ad platforms so bidding algorithms optimize for actual profit rather than cheap form fills.
Phase 3: Layer Qualitative “Self-Reported Attribution”
Even the best software cannot see inside “Dark Social”—private Slack communities, WhatsApp forwards, word-of-mouth dinner recommendations, or unlinked podcast mentions.
Add a mandatory, single-line open-text field on your checkout or demo booking form asking: “How did you first hear about us?”
Compare self-reported responses against your digital attribution reports every month. When 35% of demo requests write “Heard your founder on a podcast” while GA4 attributes those same conversions to “Branded Organic Search,” you have uncovered crucial hidden ROI.