
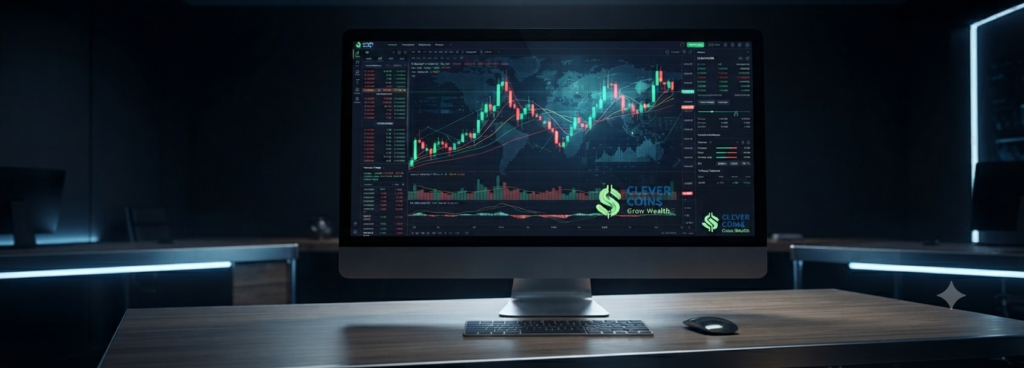
Technical Analysis: The Ultimate Beginner’s Guide to Candlestick Basics
Introduction: Decoding the Language of the Market
If you have ever stared at a financial chart flashing red and green bars, wondering how traders make sense of the chaos, you are looking at the universal heartbeat of global markets: candlestick charts.
Technical analysis is not about fortune-telling; it is about reading human psychology, supply, and demand. At the core of every financial market—whether you are trading equities, forex, commodities, or crypto—lies price action. And the most effective tool for visualizing price action is the candlestick.
Derived from 18th-century Japanese rice merchants trading on the Osaka futures exchanges, candlesticks offer an intuitive, data-rich window into market sentiment. Unlike traditional line charts that only show closing prices, a single candlestick packs four vital data points into one clean visual block: Open, High, Low, and Close (OHLC).
In this deep-dive guide brought to you by CleverCoins, we will break down the anatomy of a candlestick, explore core patterns, and build your confidence in reading technical charts from scratch.
Section 1: The Anatomy of a Candlestick
Before diving into complex chart patterns, you must understand how a single candle is constructed. Every individual candle represents a specific timeframe—ranging from a 1-minute chart to a 1-month macro chart.
A standard candlestick consists of three primary components:
- The Real Body: The thick rectangular block representing the range between the Open and Close prices for that specific timeframe.
- Bullish Candle (Usually Green or White): Indicates that the price closed higher than it opened. Buyers were in control during this period.
- Bearish Candle (Usually Red or Black): Indicates that the price closed lower than it opened. Sellers dominated the session.
- The Upper Shadow (Wick / Tail): The thin vertical line extending above the real body. It marks the maximum price reached during that time period.
- The Lower Shadow (Wick / Tail): The thin vertical line extending below the real body. It marks the minimum price reached during that time period.
The OHLC Relationship
- Open: Where price started when the candle period began.
- High: The absolute peak price buyers could push the asset to before facing rejection.
- Low: The absolute floor price sellers could force the asset down to before buyers stepped in.
- Close: The final price recorded when the candle period ended. This is arguably the most crucial data point for traders.
Section 2: Single Candlestick Patterns (The Building Blocks)
While multi-candle formations carry immense predictive power, single candlesticks tell a powerful story of tug-of-war between bulls (buyers) and bears (sellers).
1. Marubozu (The Power Candle)
- What it looks like: A long real body with no upper or lower shadows (or extremely tiny wicks).
- Psychology: A Bullish Marubozu means buyers controlled the market from the opening bell to the closing bell without a single moment of hesitation. A Bearish Marubozu signifies total dominance by sellers.
- Trading Implication: Indicates strong continuation momentum in the direction of the candle.
2. Hammer and Hanging Man
- What it looks like: A small real body at the upper end of the trading range, with a lower shadow that is at least twice the length of the real body, and little to no upper shadow.
- Hammer (Bullish Reversal): Appears at the bottom of a downtrend. It shows that sellers drove prices down heavily during the session, but a massive wave of buyers stepped in before the close, pushing prices back up.
- Hanging Man (Bearish Reversal): Appears at the top of an uptrend. Even though it looks identical to a hammer, its context at a market peak suggests buyers are losing their grip.
3. Shooting Star and Inverted Hammer
- What it looks like: A small real body at the lower end of the range, with a long upper shadow at least twice the length of the body.
- Shooting Star (Bearish Reversal): Found at the peak of an uptrend. Bulls tried to push prices higher, but aggressive sellers rejected the highs, forcing the price back down near the open.
- Inverted Hammer (Bullish Reversal): Found at the bottom of a downtrend, signaling potential buyer accumulation.
4. Doji (The Indecision Candle)
- What it looks like: The Open and Close prices are virtually identical, resulting in a very thin or non-existent real body with crossing wicks.
- Psychology: Neither buyers nor sellers could gain control. It represents market equilibrium and high uncertainty.
- Variations:
- Gravestone Doji: Long upper shadow, open/close at the low (bearish reversal sign).
- Dragonfly Doji: Long lower shadow, open/close at the high (bullish reversal sign).
Section 3: Dual Candlestick Patterns (Shifts in Momentum)
When two consecutive candlesticks interact, they often reveal dramatic shifts in market sentiment.
1. Bullish and Bearish Engulfing Patterns
- Bullish Engulfing: Occurs in a downtrend. A small red candle is immediately followed by a large green candle that completely “engulfs” the body of the previous red candle. This signals that buyers have overwhelmed sellers.
- Bearish Engulfing: Occurs in an uptrend. A small green candle is followed by a massive red candle that swallows the prior body, signaling a sudden takeover by sellers.
2. Harami Pattern (The Pregnant Bar)
- Bullish Harami: A large red candle followed by a small green candle completely contained within the vertical range of the previous body. It indicates that the previous selling momentum is slowing down.
- Bearish Harami: A large green candle followed by a small red candle contained inside it, warning of potential exhaustion in an uptrend.
3. Piercing Line and Dark Cloud Cover
- Piercing Line (Bullish): Appears in a downtrend. A long red candle is followed by a green candle that opens lower than the previous low but closes above the midpoint of the prior red body.
- Dark Cloud Cover (Bearish): Appears in an uptrend. A green candle is followed by a red candle opening higher but closing below the midpoint of the prior green body.
Section 4: Triple Candlestick Patterns (Major Trend Reversals)
Triple-candle combinations are among the most reliable indicators for spotting macro trend shifts.
1. Morning Star and Evening Star
- Morning Star (Bullish Reversal): Composed of three candles:
- A long red candle continuing a downtrend.
- A small-bodied candle (the “star”—can be green or red) that gaps down.
- A strong green candle that closes well into the body of the first candle.
- Evening Star (Bearish Reversal): Composed of three candles at the top of an uptrend:
- A long green candle.
- A small gapping star candle showing indecision.
- A heavy red candle driving deep into the first candle’s gains.
2. Three White Soldiers and Three Black Crows
- Three White Soldiers: Three consecutive long-bodied green candles opening within the previous candle’s body and closing near their highs. This screams a powerful bullish trend reversal.
- Three Black Crows: Three consecutive long-bodied red candles stepping downward. This signifies aggressive distribution and a shift to a bear market.
Section 5: Common Mistakes Beginners Make with Candlesticks
Reading candlesticks is an art form that requires discipline. Avoid these classic pitfalls:
- Trading in Isolation: Never trade a pattern simply because it appeared. Context matters. A hammer at a major support level is powerful; a hammer in the middle of a sideways ranging market is noise.
- Ignoring Volume: Price moves on volume. A breakout or reversal accompanied by high trading volume is far more valid than one with weak, shrinking volume.
- Failing to Wait for Confirmation: Entering a trade mid-candle is risky because the price can shift drastically before the close. Waiting for the candle to close (or for confirmation from the next candle) protects your capital.
- Neglecting Multi-Timeframe Analysis: A reversal pattern on a 5-minute chart might just be a minor pullback on a daily chart. Always align your trades with the higher timeframe trend.
Conclusion: Putting Knowledge into Practice
Mastering candlestick basics is the foundational step toward becoming a disciplined, systematic trader. Technical analysis does not promise a 100% win rate; rather, it provides a probabilistic framework to manage risk, spot structural turning points, and optimize entry and exit points.
At CleverCoins, we believe that financial literacy and smart strategic planning are the dual pillars of long-term wealth creation. Practice reading charts on historical data, backtest your observations, and always manage your risk before chasing rewards.
Disclaimer: Technical analysis involves risk. Never trade with capital you cannot afford to lose. Always perform your own due diligence or consult a qualified financial advisor.
Section 6: Frequently Asked Questions (FAQs)
Q1: What is the single most important part of a candlestick?
A: The Close price is widely considered the most important element because it dictates who won the battle for that session—buyers or sellers.
Q2: Are candlestick patterns 100% accurate?
A: No. Candlestick patterns represent probabilities, not certainties. They should always be used alongside indicators like Moving Averages, RSI, and Volume.
Q3: Which timeframe is best for beginners to practice candlestick analysis?
A: Daily and 4-hour charts are ideal for beginners because they filter out market “noise” and micro-fluctuations found on 1-minute or 5-minute charts.
- Phone: +91 77389 59862
- Email: client@clevercoins.org
- Address: Ideal Market, Mumbra, Thane-400612
Website: https://clevercoins.org/