How to Read a Balance Sheet: The Complete Step-by-Step Guide for Investors and Business Owners
If you have ever looked at a company’s financial statements and felt like you were staring at a wall of alien hieroglyphics, you are not alone. Most people skip straight to the headline numbers—revenue, profit, or stock price—and ignore the single most revealing document a business produces.
That document is the balance sheet.
Learning how to read a balance sheet is the closest thing to developing X-ray vision in business and investing. While an income statement tells you how much money a company made over a period of time, the balance sheet reveals what the company actually owns, what it owes, and what is truly left over for the owners at a specific moment in time. It tells you whether a seemingly profitable business is secretly drowning in short-term debt, or whether a temporarily unprofitable company is sitting on a fortress of cash.
Whether you are a retail investor evaluating stocks, a small business owner managing your own books, an entrepreneur pitching investors, or a finance student building foundational literacy, this complete guide will walk you through every line item, formula, ratio, and warning sign you need to master.
What Is a Balance Sheet?
A balance sheet (also formally known as the Statement of Financial Position) is one of the three core financial statements used to evaluate a business, alongside the Income Statement (Profit and Loss) and the Cash Flow Statement.
Think of the three financial statements like this:
The Income Statement is a video showing financial performance over a stretch of time (a quarter or a full year).
The Cash Flow Statement is a bank ledger tracking actual cash moving in and out of the doors during that same period.
The Balance Sheet is a photograph—a high-resolution snapshot taken at the exact stroke of midnight on the final day of an accounting period (for example, December 31, 2026).
Because it is a snapshot in time, every number on a balance sheet represents a cumulative balance up to that exact date, rather than a flow of activity over several months.
The Fundamental Accounting Equation
Every single balance sheet in the world—from a neighborhood coffee shop to Apple or Microsoft—is built on one unbreakable mathematical law known as the Accounting Equation:
Why must both sides always equal each other? Because every resource a company owns (its Assets) had to be paid for somehow. There are only two ways a business can acquire an asset:
By borrowing money or taking on an obligation (Liabilities).
By using money invested by the owners or profits retained inside the business (Shareholders’ Equity).
If a company buys a $50,000 delivery van using $10,000 of its own cash and a $40,000 bank loan, its assets increase by $40,000 net (up $50,000 for the van, down $10,000 for cash), and its liabilities increase by $40,000 (the loan). Both sides remain in exact equilibrium. If a balance sheet does not balance, an accounting error has occurred.
How a Balance Sheet Is Structured
Before diving into specific line items, it helps to understand the visual layout. Companies present balance sheets in one of two standard formats:
The Report Format (Vertical): Assets are listed at the top, followed by Liabilities in the middle, and Shareholders’ Equity at the bottom. This is the most common layout in annual reports (10-K filings) and digital financial platforms.
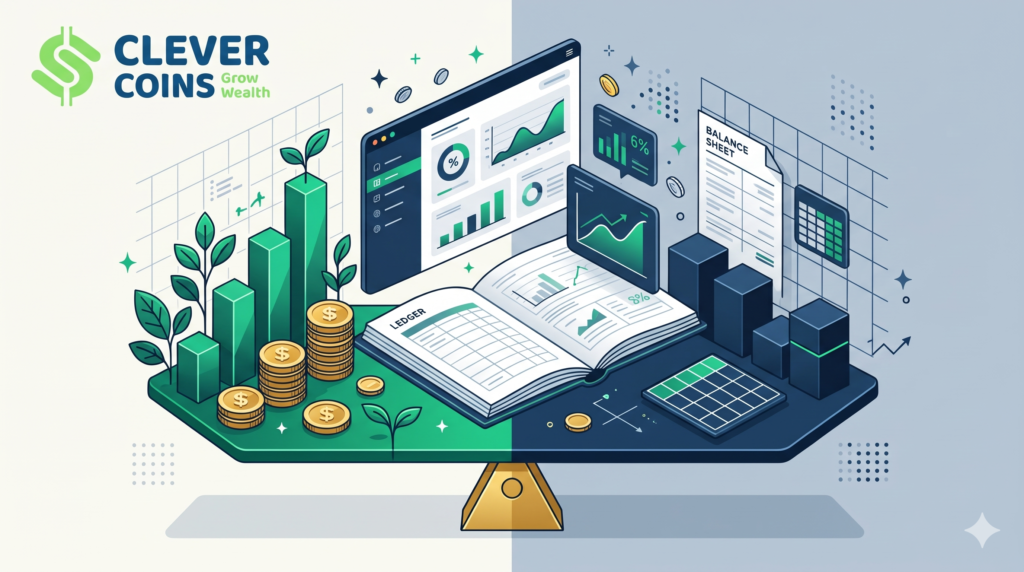
The Account Format (Horizontal): Assets appear on the left side, while Liabilities and Shareholders’ Equity appear side-by-side on the right. This visually mirrors a classic weighing scale.
Order of Liquidity and Maturity
Line items on a balance sheet are never listed randomly. They follow a strict hierarchy:
Assets are listed in order of liquidity—meaning how quickly they can be converted into cold, hard cash. Cash sits at the very top; factories, land, and patents sit near the bottom.
Liabilities are listed in order of maturity—meaning how soon they must be paid off. Bills due in 30 days sit at the top; 10-year corporate bonds sit near the bottom.
Most public companies also present comparative columns, showing the current period’s numbers alongside the prior year’s numbers (e.g., 2026 vs. 2025). Always read across both columns—direction and momentum matter just as much as static numbers.
Part 1: Decoding Assets (What the Company Owns)
An asset is any economic resource controlled by the business that is expected to generate future financial benefit. Assets are divided into two major buckets: Current Assets and Non-Current (Long-Term) Assets.
1. Current Assets (Short-Term Resources)
Current assets are cash and other resources that the company expects to convert into cash, sell, or consume within one year (or within one normal operating cycle). High current assets give a company breathing room to pay bills and survive economic downturns.
Cash and Cash Equivalents: The purest form of liquidity. This includes physical currency, checking and savings account balances, and ultra-safe, short-term investments maturing in 90 days or less (such as U.S. Treasury bills and money market funds).
Marketable Securities: Short-term, liquid investments like commercial paper, certificates of deposit (CDs), or publicly traded stocks/bonds held for less than a year that can be sold rapidly on open exchanges.
Accounts Receivable (A/R): Money owed to the company by customers who bought goods or services on credit. While A/R is a legitimate asset, watch it closely: if Accounts Receivable is growing much faster than sales, customers may be struggling to pay their bills. Companies also deduct an “Allowance for Doubtful Accounts”—an estimate of invoices that will likely never be collected.
Inventory: Raw materials, work-in-progress goods, and finished products sitting in warehouses or on store shelves waiting to be sold. Inventory is vital for retailers and manufacturers, but excess or obsolete inventory ties up cash and may eventually have to be written down at a loss.
Prepaid Expenses: Bills the company has already paid in advance for future benefits—such as a 12-month commercial insurance policy, annual software subscriptions, or prepaid rent. Because the company has already paid for the service, it holds a right to receive value over the coming months.
2. Non-Current Assets (Long-Term Resources)
Non-current assets are long-term investments and operational infrastructure expected to provide value for more than one year. They cannot be quickly liquidated without disrupting the business.
Property, Plant, and Equipment (PP&E): Also called fixed assets or tangible assets. These are physical items like land, office buildings, factories, heavy machinery, delivery fleets, and computer servers. PP&E is recorded at its original purchase price minus Accumulated Depreciation (the gradual accounting write-off of wear and tear over time). Note: Land is never depreciated.
Long-Term Investments: Stakes in other companies, corporate bonds, or real estate held for strategic purposes or long-term capital appreciation rather than quick sale.
Intangible Assets: Non-physical assets that carry immense competitive value. Examples include patents, trademarks, copyrights, brand names, proprietary software, and customer lists. Like PP&E, finite-life intangibles lose value over time through a process called amortization.
Goodwill: One of the most misunderstood lines on any balance sheet. Goodwill only appears when one company acquires another company for more than the fair market value of its net identifiable assets. That extra premium—paid for the target’s brand reputation, talent, or customer loyalty—is recorded as Goodwill. Goodwill is not amortized annually, but companies must test it for impairment; if an acquisition flops, the company must write down Goodwill, resulting in a massive hit to earnings.
Part 2: Decoding Liabilities (What the Company Owes)
A liability is a legal financial obligation or debt that the company owes to outside parties—such as banks, suppliers, employees, landlords, or tax authorities. Just like assets, liabilities are separated into Current Liabilities and Non-Current Liabilities.
1. Current Liabilities (Short-Term Obligations)
Current liabilities are debts and obligations due within 12 months. To stay solvent, a company must generate enough cash or maintain enough current assets to cover these obligations on time.
Accounts Payable (A/P): The exact mirror image of Accounts Receivable. A/P represents unpaid bills the company owes to its suppliers and vendors for inventory, raw materials, or services already delivered on credit.
Short-Term Debt / Current Portion of Long-Term Debt: Bank lines of credit, short-term commercial paper, and any principal payments on multi-year loans or bonds that come due within the next 12 months.
Accrued Expenses (Accrued Liabilities): Expenses the company has already incurred during the accounting period but has not yet received an invoice for or paid out in cash. Common examples include earned employee wages payable on Friday, accrued interest on loans, utility usage, and income taxes payable.
Unearned Revenue (Deferred Revenue): Cash collected from customers before the company has delivered the product or service. Think of annual SaaS subscriptions, airline tickets bought months ahead, or gift cards. Even though the cash is in the bank, accounting rules treat it as a liability until the company fulfills its promise to the customer. For subscription businesses, growing deferred revenue is actually a sign of strong demand!
2. Non-Current Liabilities (Long-Term Obligations)
Non-current liabilities are financial obligations due more than one year in the future. They allow companies to finance major expansions without immediate repayment pressure, though they carry ongoing interest costs.
Long-Term Debt: Multi-year bank term loans, mortgages on corporate real estate, and corporate bonds issued to institutional investors. Heavy long-term debt amplifies returns during good times (financial leverage) but can bankrupt a business if revenues drop and interest payments become unaffordable.
Long-Term Lease Liabilities: Under modern accounting standards (ASC 842 / IFRS 16), companies must record the present value of future multi-year lease commitments (for retail stores, warehouses, or equipment) directly on the balance sheet.
Deferred Tax Liabilities: Taxes that have been assessed based on accounting profits but are legally postponed to future years due to timing differences between financial accounting rules and IRS/tax authority rules (such as accelerated depreciation).
Pension and Post-Retirement Obligations: Long-term promises made by established corporations to pay retirement pensions or healthcare benefits to current and former employees.
Part 3: Decoding Shareholders’ Equity (What Belongs to the Owners)
Shareholders’ Equity (also called Stockholders’ Equity or Owner’s Equity) represents the residual claim on the company’s assets after every single liability has been paid off:
In plain English, if a business sold every asset at its balance sheet value and paid off every creditor, Shareholders’ Equity is the net worth left over for the owners.
Key components inside the equity section include:
Common Stock & Preferred Stock: The nominal (“par”) value of shares issued by the corporation to investors. Par value is usually a tiny statutory figure (like $0.001 per share) and does not reflect the stock’s market price.
Additional Paid-In Capital (APIC): The actual amount of money investors paid above the par value when buying shares directly from the company during an IPO or secondary stock offering.
Retained Earnings: Arguably the most important line in the equity section. Retained Earnings represent the cumulative net profits the company has earned since day one, minus any dividends paid out to shareholders. Growing retained earnings show a business that consistently generates profit and reinvests it to compound growth. (If a company has lost money overall since inception, this line appears as an Accumulated Deficit.)
Treasury Stock: Shares that the company previously issued to the public and later bought back on the open market (share buybacks). Because buying back stock uses cash and reduces net equity, Treasury Stock appears as a negative number on the balance sheet.
Accumulated Other Comprehensive Income (AOCI): Unrealized gains or losses that bypass the standard income statement, such as foreign currency translation adjustments or fluctuations in certain pension and hedging instruments.
Practical Walkthrough: Reading a Sample Balance Sheet
Theory is great, but seeing real numbers side by side makes everything click. Let’s examine the balance sheet of a fictional mid-sized consumer electronics company, Apex Audio Corp., as of December 31, 2026.
Apex Audio Corp. — Consolidated Balance Sheet (As of December 31, 2026)
(All figures in thousands of dollars)
| Line Item | 2026 ($k) \vert{} 2025 ($k) | YoY Change |
| ASSETS | ||
| Current Assets | ||
| Cash and Cash Equivalents | $18,500 | $14,200 |
| Marketable Securities | $4,000 | $3,500 |
| Accounts Receivable, net | $12,000 | $10,800 |
| Inventory | $15,500 | $14,000 |
| Prepaid Expenses | $1,500 | $1,300 |
| Total Current Assets | $51,500 | $43,800 |
| Non-Current Assets | ||
| Property, Plant & Equipment (PP&E), net | $38,000 | $36,500 |
| Intangible Assets, net | $6,500 | $7,200 |
| Goodwill | $9,000 | $9,000 |
| Total Non-Current Assets | $53,500 | $52,700 |
| TOTAL ASSETS | $105,000 | $96,500 |
| LIABILITIES | ||
| Current Liabilities | ||
| Accounts Payable | $9,500 | $8,900 |
| Accrued Expenses | $4,200 | $3,800 |
| Short-Term Debt | $5,000 | $6,500 |
| Unearned Revenue | $2,300 | $1,800 |
| Total Current Liabilities | $21,000 | $21,000 |
| Non-Current Liabilities | ||
| Long-Term Debt | $28,000 | $32,000 |
| Deferred Tax Liabilities | $3,000 | $2,500 |
| Total Non-Current Liabilities | $31,000 | $34,500 |
| TOTAL LIABILITIES | $52,000 | $55,500 |
| SHAREHOLDERS’ EQUITY | ||
| Common Stock & APIC | $20,000 | $20,000 |
| Retained Earnings | $36,000 | $23,000 |
| Treasury Stock | ($3,000) | ($2,000) |
| TOTAL SHAREHOLDERS’ EQUITY | $53,000 | $41,000 |
| TOTAL LIABILITIES & EQUITY | $105,000 | $96,500 |
What Story Does This Balance Sheet Tell?
Within 60 seconds of scanning Apex Audio Corp.’s numbers, four powerful insights jump off the page:
The Equation Balances: Total Assets ($105,000k) equal Total Liabilities ($52,000k) + Total Equity ($53,000k).
Strong Liquidity Cushion: Current Assets ($51,500k) are more than double Current Liabilities ($21,000k). Apex has plenty of short-term firepower to cover its immediate obligations.
Active De-Leveraging: Both Short-Term Debt (-23.1%) and Long-Term Debt (-12.5%) decreased over the year. Management is paying down debt while simultaneously growing its cash pile (+30.3%).
Organic Wealth Creation: Retained Earnings surged by $13,000k (+56.5%), proving the company is genuinely profitable and compounding shareholder equity rather than relying on external borrowing.